Digital Marketing Concepts: Theories, Metrics, and Tools
(Advanced Digital Marketing)
Agenda
Concepts
Metrics
Web Analytics
Data
Online Research Methods
Analytics & Data Tools
Theories
Economics of Digital Marketing
Technology Changes. Economic Laws do not.
Cost Reductions
Lower search costs for customers.
Lower replication costs for certain digital goods.
Lower transportation costs in transporting digital goods.
Lower tracking costs enabling personalization and targeting.
Lower verification costs of customers’ wishes and firms’ reputations.
Cost Reduction Theory
- Search Cost Theory
- Digital technologies reduce cost of collecting, storing, & parsing customer data
- Facilitates easier product and discovery and price comparison
- Non-rivalry Theory (Zero Replication Costs)
- Digital goods can be consumer without reducing availability to others
- Challenges traditional pricing and distribution models
- Transportation Cost Theory
- Information in bit and bytes can be transported at near zero cost
- Eliminates geographic constraints for digital goods
Cost Reduction Theory (2)
- Tracking Cost Theory
- Low-cost tracking enables fine segmentation and presonalization
- Links individual behavior across multiple digital contexts
- Verification Cost Theory
- Digital techs reduce cost of verifying customers’ preferences and firms’ reputation
- Enables new trust mechanisms (reputation systems, reviews)
These cost reductions make marketing a “testing lab” for understanding broader economic transformations in the digital economy.
Reflect
E-commerce Platform Design
You’re consulting for an online fashion retailer. They’re debating whether to:
Make all price information visible on product listing pages, OR
Require customers to click into individual product pages to see prices
Focus on the following:
Identify Search Costs: What specific search costs do consumers face in this scenario? Consider both explicit costs (time, effort, clicks) and implicit costs (cognitive load, decision fatigue).
Strategic Implications: How might the firm strategically manipulate search costs to their advantage? What are the potential risks and benefits of increasing vs. decreasing search costs in this context?
Use search cost theory to justify your answer.
Metrics
Key Terminologies
You cannot manage what you cannot measure. What gets measured, gets done!
Business Objectives: Answers “What do we want to achieve?”
- Business objective should be doable, understandable, measurable, and beneficial.
Goals: Goals are specific strategies you’ll leverage to accomplish your business objectives.
- Goals should be specific, measurable, achievable, relevant, and time-bound.
Metric: It is a number.
Key Performance Indicator (KPI): A key performance indicator (KPI) is a metric that helps you understand how you are doing against your objectives.
North Star Metric: The one metric that best captures the core value your product delivers to customers.
An Example
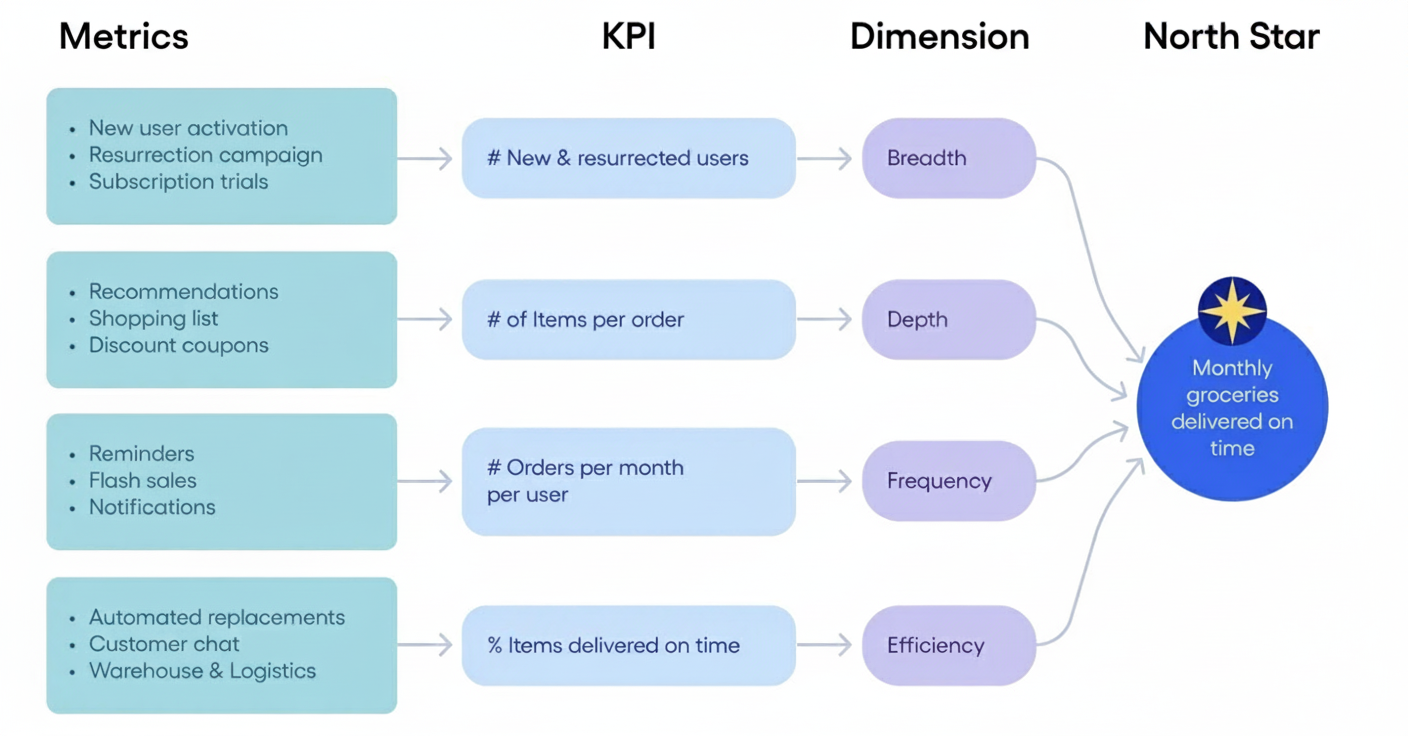
Context: grocery ordering and delivery app
Firm Performance: Profit
\[Profit = Revenue - Cost\]
\[ \begin{aligned} \pi = & p \times (MKTSIZE \times MKTSHARE) - \\ & [c \times (MKTSIZE \times MKTSHARE) + FC] \end{aligned} \]
where \[ \begin{aligned} \pi & = \text{Profit} \\ p & = \text{Unit price of product} \\ MKTSIZE & = \text{Marketing Size (in number)} \\ MKTSHARE & = \text{Market Share (in proportion)} \\ c & = \text{Unit Cost of Production} \\ FC & = \text{Fixed Cost of Production} \end{aligned} \]
For startups, the question of profitability is a difficult one to answer. Therefore, to simplify the complexity of measuring profitability, the focus should be on unit economics. Unit economics is measuring profit on a per unit basis. The unit will be customer.
Firm Performance: Marginal Cost
\[ MC = \frac{C_2 - C_1}{Y_2 - Y_1} = \frac{\Delta C}{ \Delta Y} \]
where \[ \begin{aligned} MC & = \text{Marginal Cost} \\ \Delta C & = \text{Change in Cost} \\ \Delta Y & = \text{Change in Output} \end{aligned} \]
Firm Performance: ROI
Return on Investment
\[ ROI = \frac{\text{Net Profit}} {\text{Cost of Investment}} \times 100% \] Alternatively,
\[ ROI = \frac{\text{Revenue} - \text{Cost}} {\text{Cost}} \times 100% \]
Measuring ROI of advertising is challenging due to multiple reasons. First, advertising is an investment in the future cash flow; and the benefits often extend beyond the current year. Second, advertising effects are often indirect and difficult to attribute to specific campaigns or channels.
Return on Ad Spending (ROAS)
\[ ROAS = \frac{\text{Revenue from Ad}} {\text{Cost of Ad}} \times 100% \]
An Example: If you spend $1,000 on advertising and generate $5,000 in revenue - then your ROAS is \(5000/1000 = 5\). Which is equivalent to 5:1 or 500%. This means you earn $5 for every $1 spent on ads.
Note that ROAS focuses on revenue, not profit. A high ROAS doesn’t guarantee profitability if your margins are low.
Marketing Return on Investment
\[ MROI = \frac{\text{Incremental financial value generated by marketing}}{\text{Cost of marketing}} \]
- Refer to reading article for this week by Farris et al. (2015)
Elasticity of Marketing
\[ e(marketing) = \frac{\text{% change in sales}}{\text{% change in marketing spend}} \]
- Example: e(advertising) = 0.08 means that a 10 per cent increase in advertising spend results in a 0.8 per cent increase in sales [(10) \(\times\) (0.08)], all else being equal.
Customer Acquisition Cost (CAC)
Customer Acquisition Cost (CAC) is the total cost of acquiring a new customer, including all marketing and sales expenses divided by the number of new customers gained.
\[ CAC = \frac{\text{Total Marketing and Sales Cost}} {\text{Number of New Customers Acquired}} \]
- An Example: If you spend $10,000 on marketing and sales in a month and acquire 100 new customers during that period, your CAC would be \(\$10,000/100 = \$100\). This means it costs you $100 to acquire each new customer.
Customer Metrics
Transactional Value
Relational Value

Transactional Metrics
Customer Spending
Customer Profitability
Customer Lifetime Value (CLV)
Relational Metrics
- Customer Satisfaction (CSAT)
- Measured through surveys asking customers to rate their satisfaction.
- Net Promoter Score (NPS)
- NPS = % of Promoters - % of Detractors
- Customer Retention Rate (CRR)
- CRR = [(E-N)/S] x 100, where E = number of customers at end of period, N = number of new customers acquired during period, S = number of customers at start of period
- Customer Churn Rate (CCR)
- CCR = 100 - CRR
- Customer Engagement Score (CES)
- It could depend on touchpoint (e.g., likes, comments, shares)
Customer Decision Making
- AIDA Framework
- Awareness -> Interest -> Desire -> Action
- Concept of Marketing Funnel
- Top of the Funnel (TOFU): Awareness and Interest
- Middle of the Funnel (MOFU): Desire
- Bottom of the Funnel (BOFU): Action
- Customer Purchase Journey Stages (Pre-purchase, purchase, post-purchase)
- Awareness
- Consideration
- Purchase
- Bonding and Advocacy
Example from a Publisher Website
| Stage of the AIDA model | Web analytics | Satisfaction barometer emails received | |
|---|---|---|---|
| Attention/awareness | Present in the top three Google search results for the keywords | Number of unique visitors | Participation rate in the satisfaction questionnaire |
| Interest/quality of experience | Number of external referrals | Average time spent, Number of pages per visit, Bounce rate | Understanding the subject matter |
| Desire/commitment | Percentage of repeat visitors | Measurement of positive vs. negative comments, Recommendation score | |
| Action/intention | RSS feed click rates | Partnership proposal, Cross link request, Recommendation score |
Example from e-Commerce
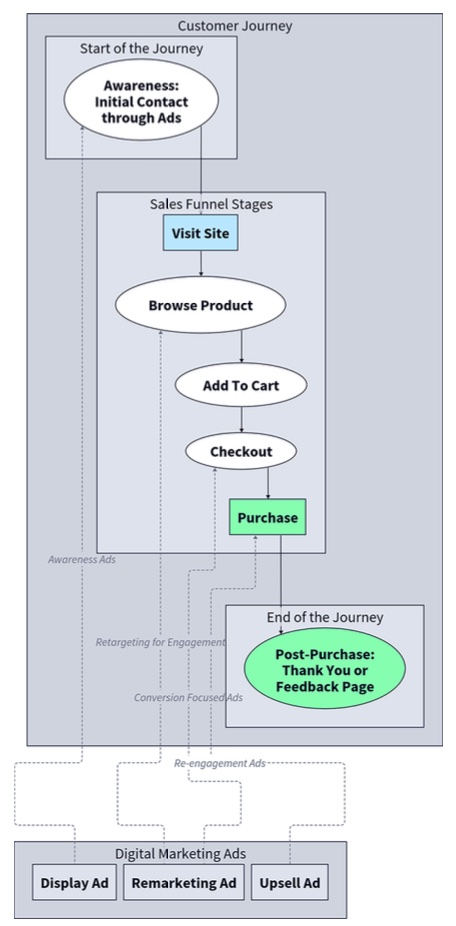
ABC Model
Digital Marketing Funnel
Acquisition: How customers find the firm/brand.
Behavior: How customers interact with the firm/brand (e.g., website, app).
Conversion: What desired actions customers take.
Reflect
The market for operating system is dominated by three key players namely: Windows, Linux, and Mac with market shares of 60%, 20%, and 10% respectively. If there are 100 million users who use an operating system, calculate the profit generated by Windows if unit price is $10 and unit variable cost (such as distribution and packaging) is $5 and fixed cost is $1 million.
[Hint: Use profit formula and calculate values for each parameter of the formula.]
Web Analytics
Definition
Wen analytics is the analysis of qualitative and quantitative data from website and the competition.
Web analytics are used to drive a continual improvement of the online experience that customers, and potential customers have.
These customer experiences translate into desired outcomes (online and offline).
Key Metrics of Web Analytics
Cost per Click (CPC): The amount you pay for each click on your ad.
Cost per Mille (CPM): The cost per 1,000 impressions of your ad.1
Cost per Action (CPA): The cost incurred for a specific action (e.g., purchase).
Cost per View (CPV): The cost incurred each time a video ad is viewed.2
Cost per Install (CPI): The cost incurred for each app installation driven by the ad.
Key Metrics of Web Analytics (2)
Clicks: Users pressing a link to a digital ad.
Click-through rate (CTR): % of people who click on online ad after seeing it.1
Impressions: The number of times an ad is shown.
Conversion rate: % of users who take a desired action after interacting with ad.2
Reach: Total number of unique users who see an ad.3
Frequency: Average number of times a single user views an ad.
Impression share: The percentage of total impressions that your ad receives compared to the total number of impressions it could get.4
- Average Order Value (AOV): The average amount spent each time a customer places an order.5
Reflect
Imagine you run two ads for a new book release.
Ad 1 is shown 20,000 times and receives 200 clicks. 4 users bought the book.
- Calculate CTR and Conversion Rate for Ad 1.
Ad 2 is shown 10,000 times and receives 400 clicks. 4 users bought the book.
- Calculate CTR and Conversion Rate for Ad 2.
Which Ad campaign performed better?
What is your recommendation for future ad campaigns?
Data
Types of Data
- Big Data (3Vs - volume, velocity, variety)
- Structured Data: Organized information that follows a predefined data model or schema, making it easily searchable and analyzable.
- Unstructured Data: Information that does not have a predefined data model or organization, making it more challenging to collect, process, and analyze.
- Origin of Data
- First-party: Information that a company collects directly from its own audience or customers through owned channels and touchpoints.
- Second-party: Another organization’s first-party data that is shared or purchased directly through a partnership or data-sharing agreement.
- Third-party: Information collected and aggregated by external organizations that don’t have a direct relationship with the consumers.
General Data Protection Regulation (GDPR)from EU, California Consumer Privacy Act (CCPA) from California, PIPL Privacy Act from Australia, and Personal Information Protection Law (PIPL) from China are some regulations to protect user data privacy. How do you think implication of this for first-party vs. second- and third-party data.
Types of Data (2)
- Online Data
- Clicstream data: Data that captures the sequence of clicks and interactions made by users while navigating a website or application.
- Server log data: Data automatically recorded by web servers that provide information about user interactions, requests, and activities on a website.
- Transaction Data
- Scanner Panel Data: Data collected from point-of-sale systems that capture detailed information about consumer purchases, including product details, prices, and quantities.
- Qualitative Data
- Survey data: Data collected through questionnaires designed to gather information about individuals’ attitudes, opinions, behaviors, or characteristics.
Online Research Methods
A/B Testing
Definition
A/B testing (split testing) is a controlled experiment that compares two versions of a variable to determine which performs better against a specific goal or outcome.
Core Concepts
- Control (A): The original/current version (baseline)
- Variant (B): The modified version being tested
- Hypothesis: Predicted outcome based on the change
- Sample Size: Number of users needed for statistical significance
- Statistical Significance: Confidence that results aren’t due to chance (typically 95%)
- Conversion Rate: Percentage of users who complete the desired action
Example: Email Marketing
Hypothesis: Personalized subject lines will improve open rates.
- Version A (Control): “Check Out These New Products” - 18% open rate
- Version B (Variant): “[
Name], Check Out These New Products” - 24% open rate - Result: 33% improvement - use personalization
- Sample: 50,000 subscribers, split evenly
Key Principles
- Test one variable at a time: Isolate what causes the change
- Random assignment: Users randomly see version A or B
- Simultaneous testing: Run both versions at the same time
- Sufficient sample size: Ensure reliable results
- Define success metrics: Clear KPIs before testing
Ghost Ads
Ghost advertising is a form of web analytics to measure the effectiveness of an online ad campaign without the user actually seeing the ad. Ghost ads are invisible to users but are tracked to gather data on impressions, clicks, and conversions. This method helps advertisers understand the potential impact of their ads without disrupting the user experience.
Analytics & Data Tools
Google Analytics
Google Analytics track website traffic, monitor user behavior, create performance dashboards, and measure conversion rates.
- GA41 gives more accurate picture of the entire customer journey (e.g.,from their first visit on a phone to their final purchase on a computer).
Demo Account
Google provides the following demo account for practice:
Where preparing report from these analytics platform you can use Looker Studio from Google that updates the information (e.g., summary, charts, graphs) in real-time as data changes in the source.
Google Analytics Dashboard
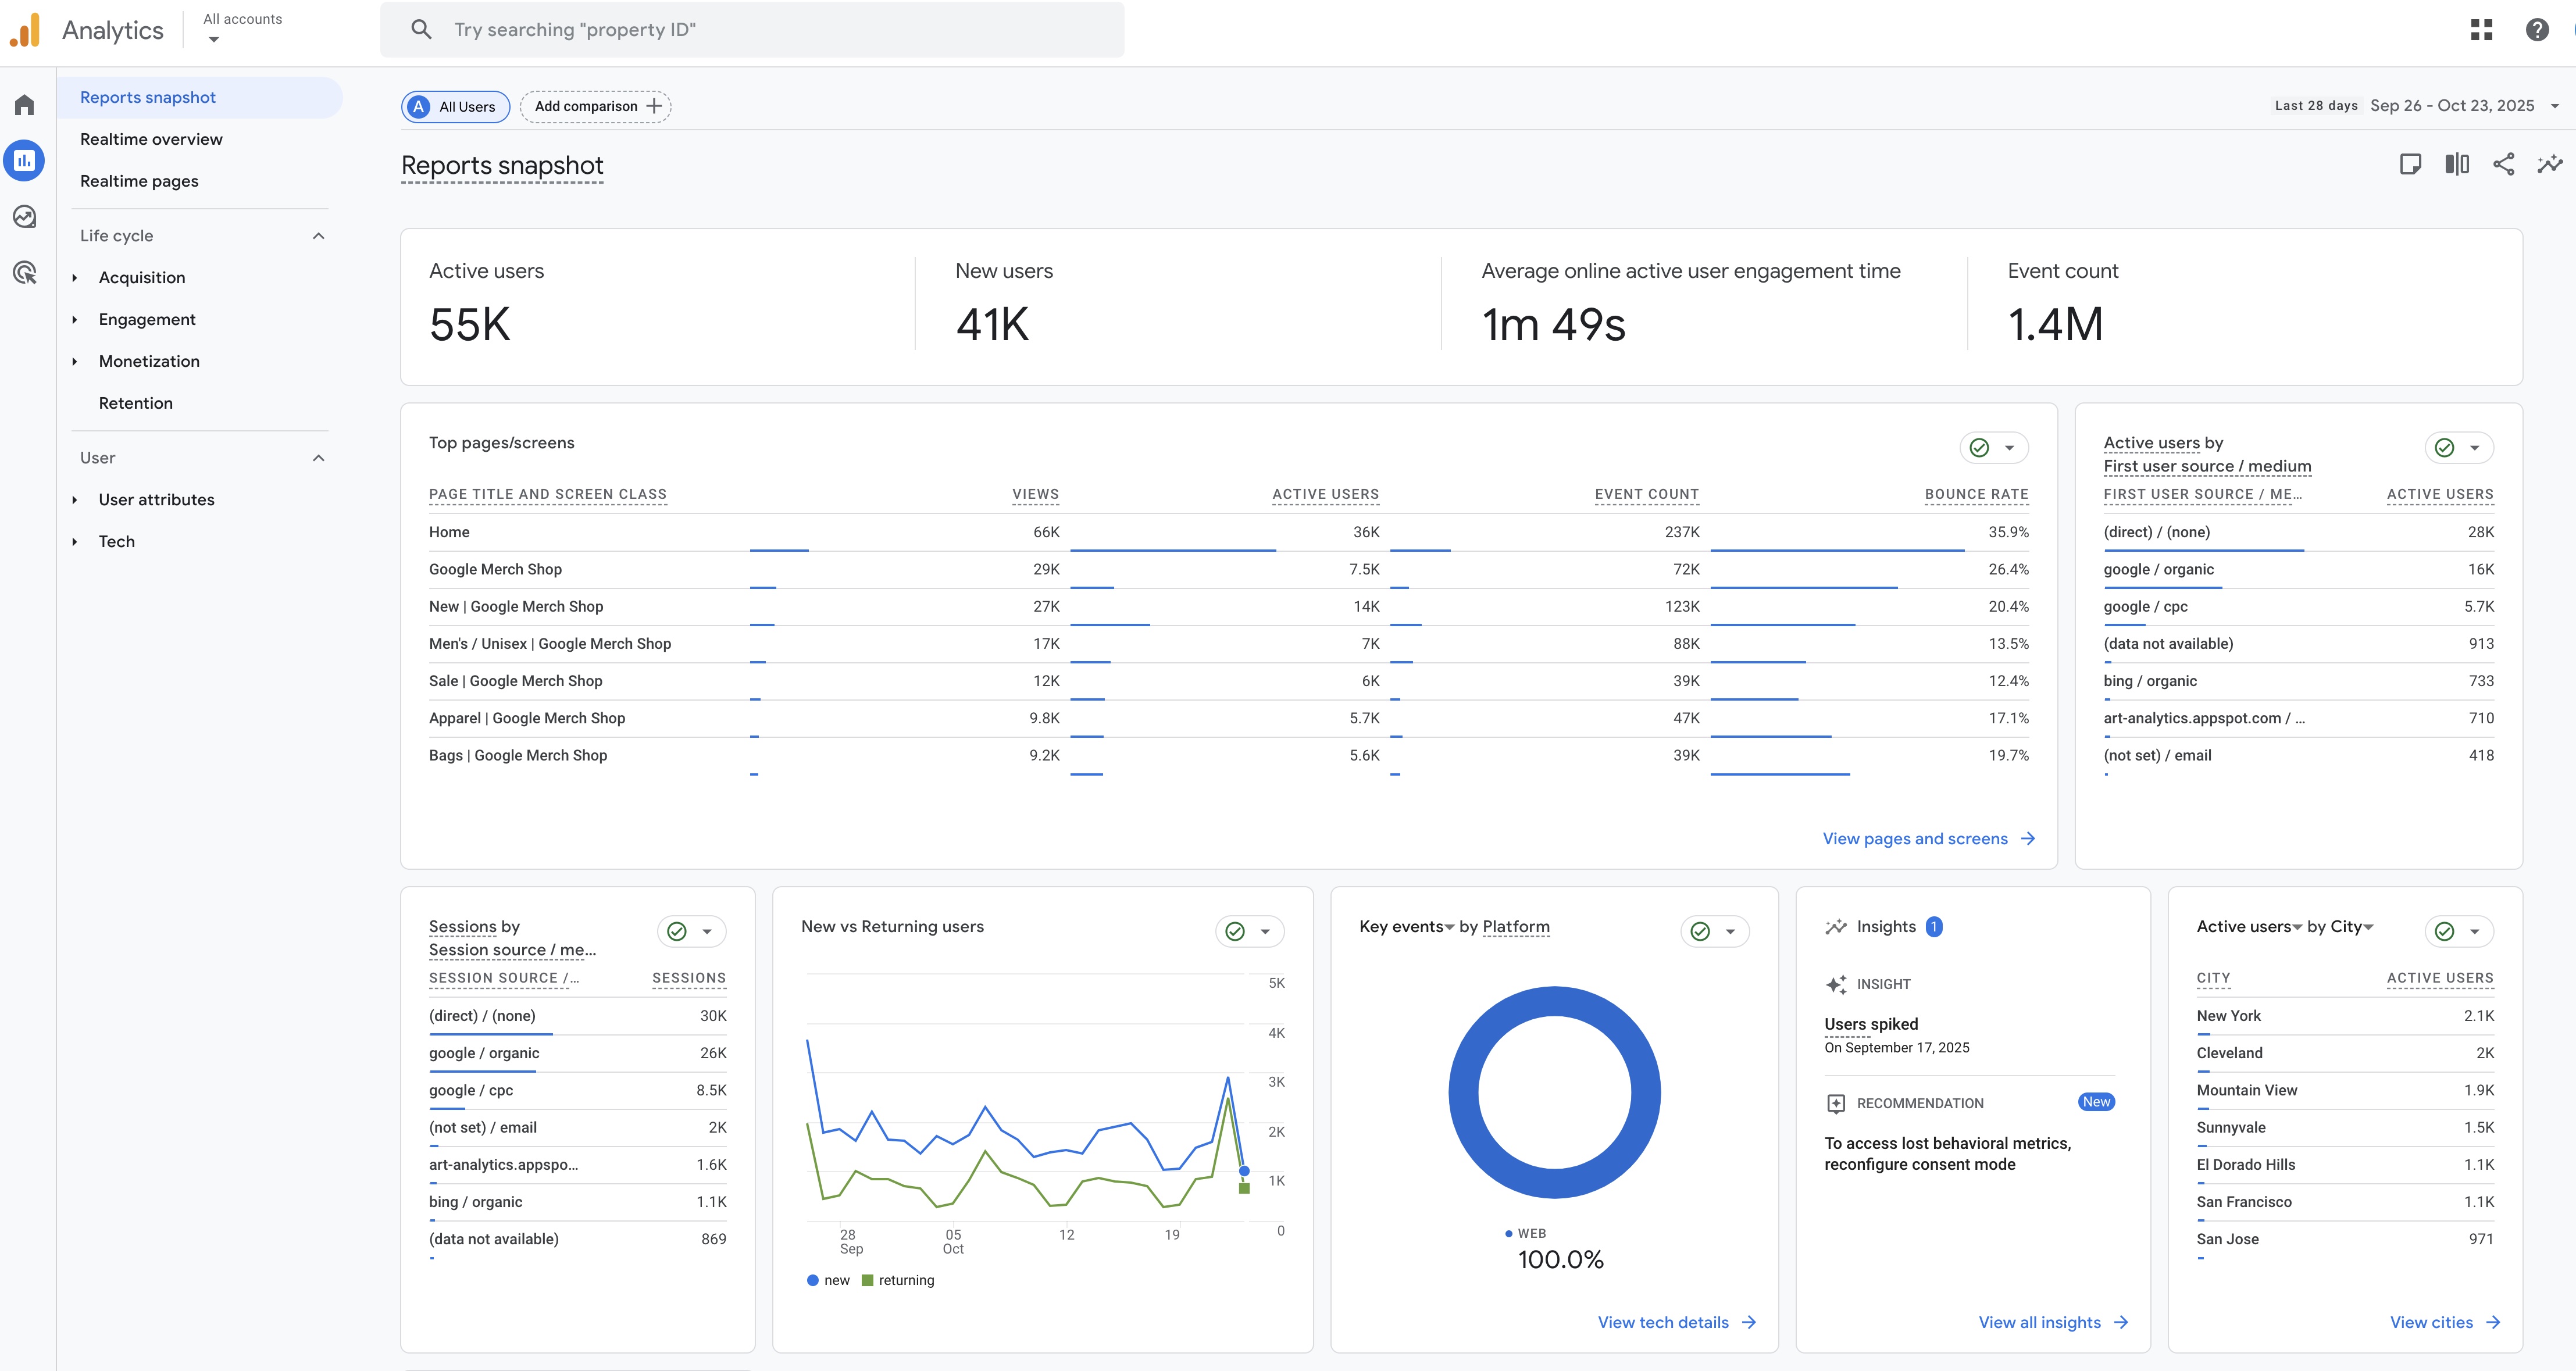
Reporting from Google Analytics
- Segmentation and Conversion Metrics
- Segment by demographics, behavior, traffic source
- Conversion goals: form submissions, purchases, sign-ups
- Audience Overview
- Users, New Users, Sessions, Bounce Rate, Session Duration
- Acquisition Overview
- Channels (Organic Search, Direct, Referral, Social)
Reflect
Create account for Google Analytics using demo account (use Google Merchandise Store as an example for e-commerce site)
Explore key reports: Audience Overview, Acquisition Overview, Behavior Flow
Try Looker Studio to generate a live report for a given period (e.g., last 30 days or last quarter)
Thank You!
🙏
Q&A
